
In the digital age, data visualization has become a cornerstone of effective communication. A well-designed Graphs Page can transform complex data into intuitive, easy-to-understand visuals, making it an indispensable tool for businesses, educators, and analysts alike.
Beyond just presenting data, a thoughtfully crafted Graphs Page enhances user experience by providing clarity and insight at a glance. Whether you're tracking performance metrics or illustrating trends, the right design can make all the difference in how information is perceived and acted upon.
This detailed sales graphs page for Nor-Shipping 2019 showcases key statistics like total deals, potential value, and hit rates. Contrasting colors and clear data points enhance readability, allowing easy comparison with previous years.
Check out this example on Dribbble.
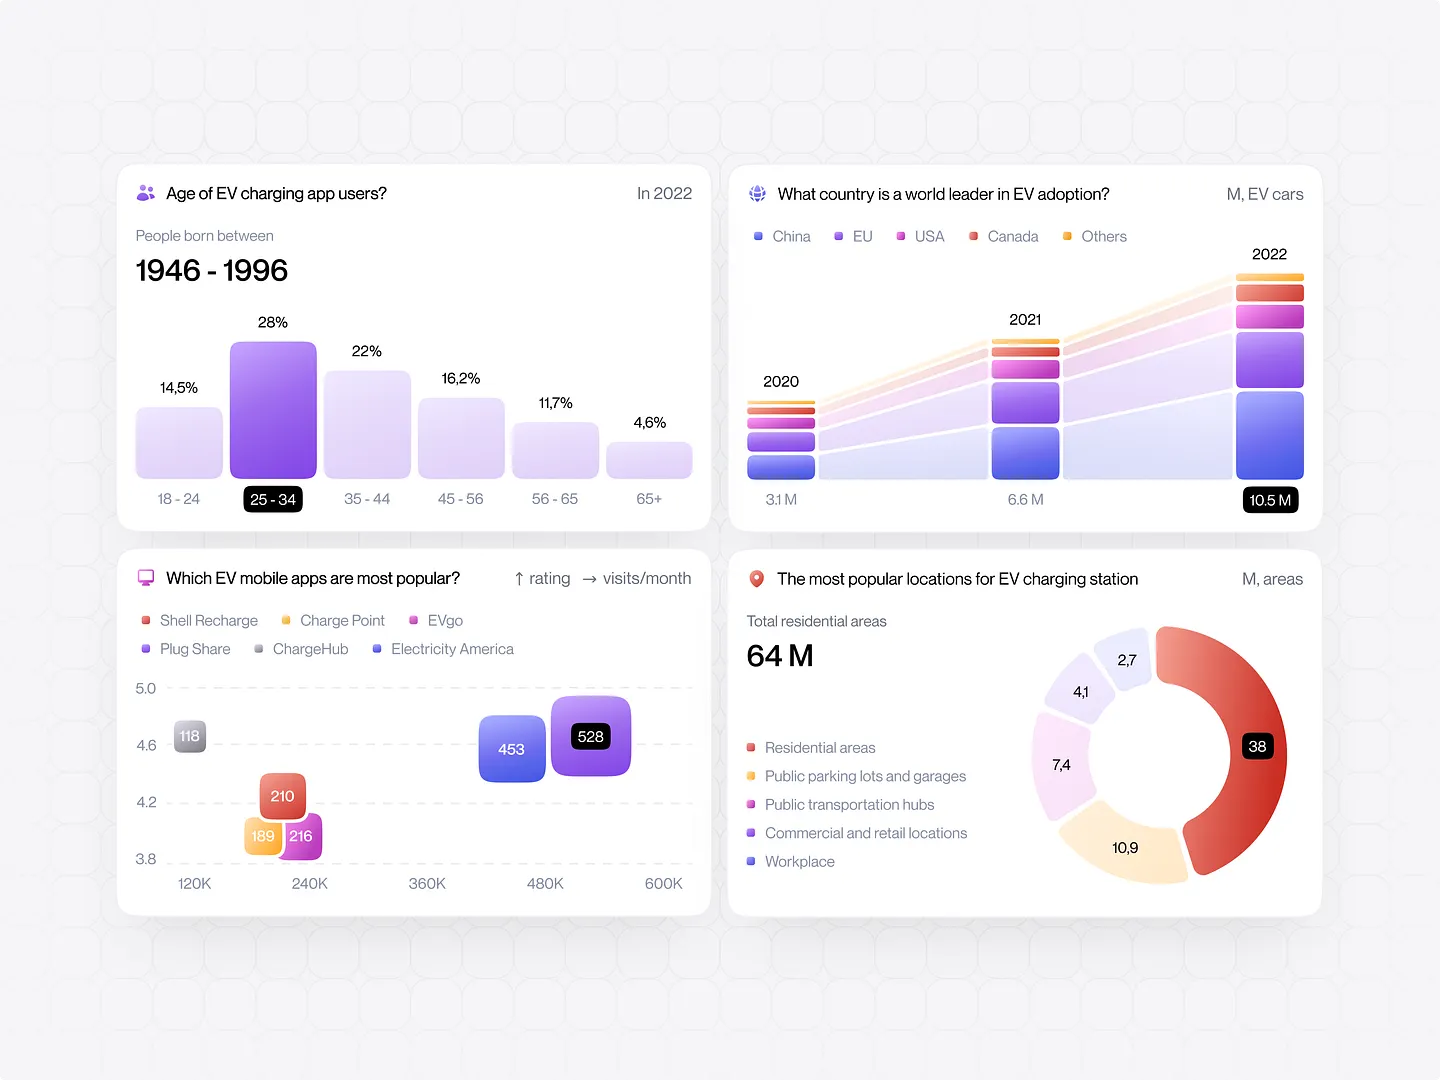
This graphs page delves into the demographics of EV charging app users, highlighting age distribution and popular mobile apps. It also provides insights on global EV adoption rates and the most frequented charging station locations, all through clear and informative charts.
Check out this example on Dribbble.
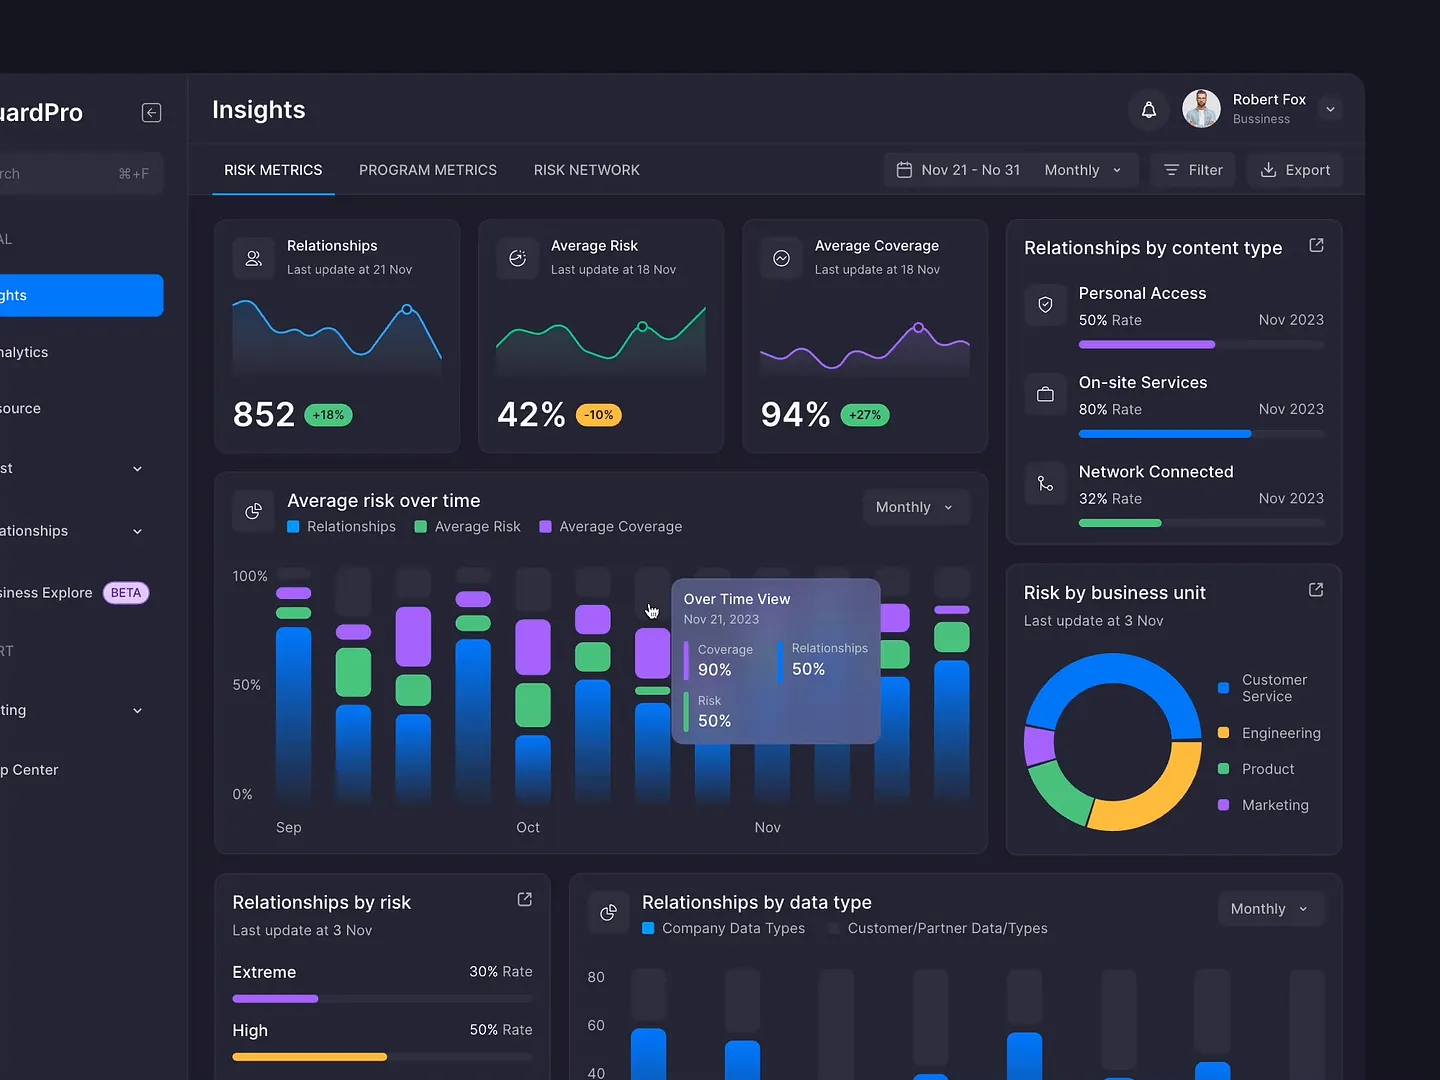
This Risk Management SaaS dashboard features dynamic charts and metrics, showcasing relationships, average risk, and coverage over time. Its sleek, dark-themed layout enhances data visualization and user experience, making complex information easily digestible.
Check out this example on Dribbble.
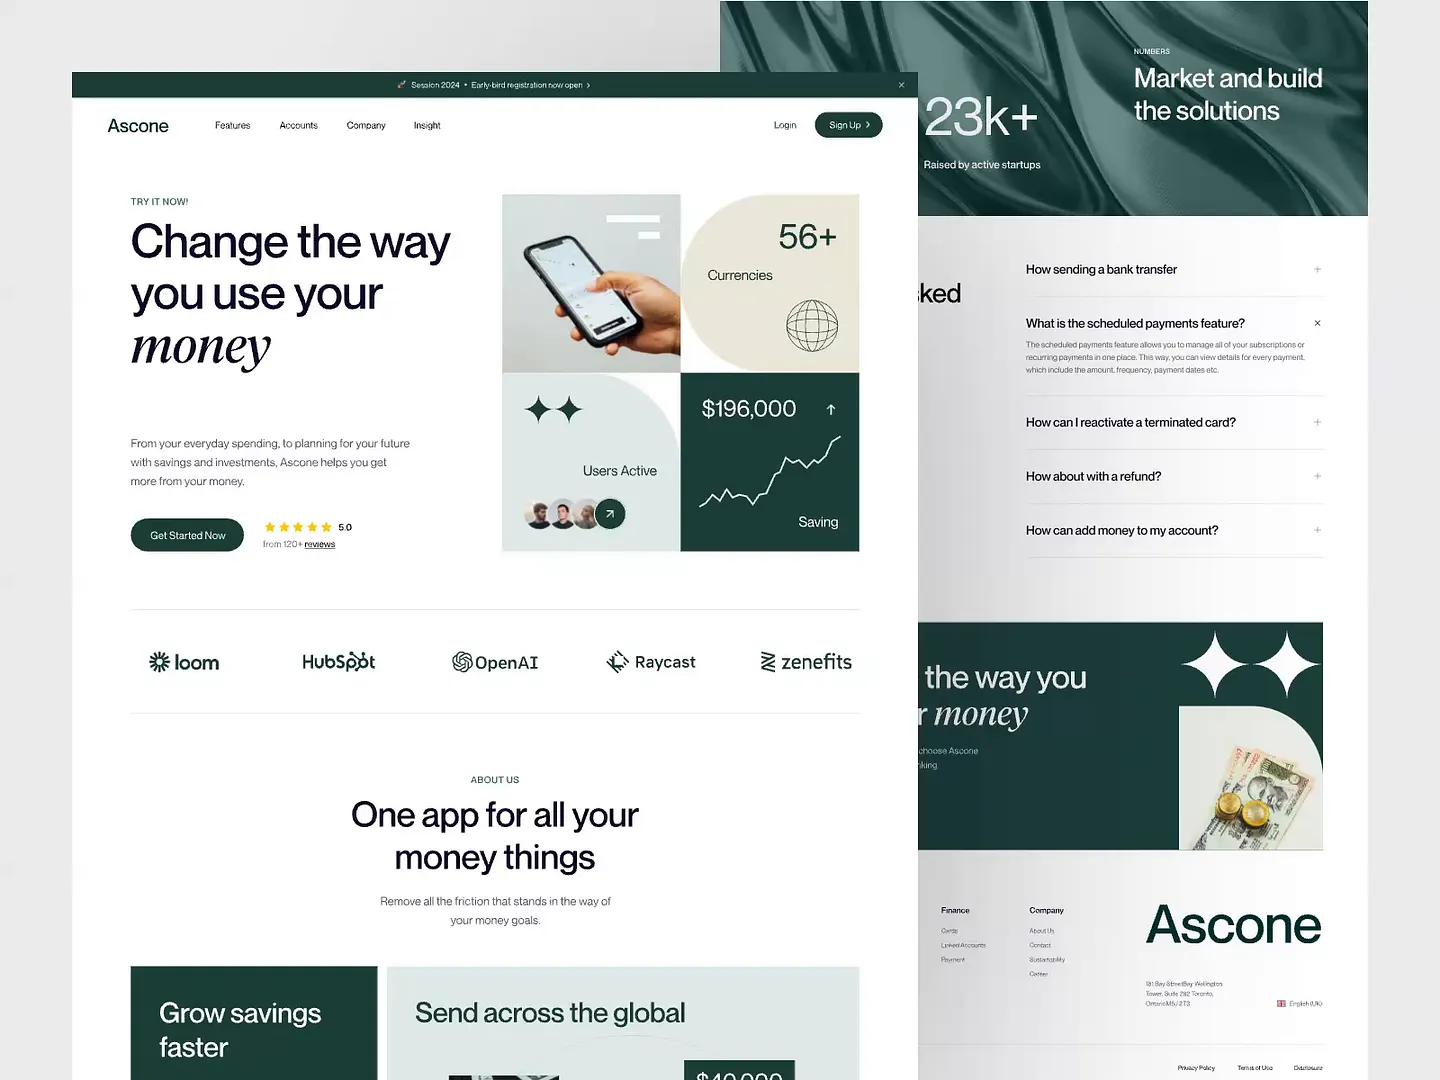
The Ascone graphs page features a sleek, modern design with dynamic data visualizations that boost user engagement. Rich greens and clean layouts effectively communicate financial insights, making it easy for users to track savings and investments.
Check out this example on Dribbble.
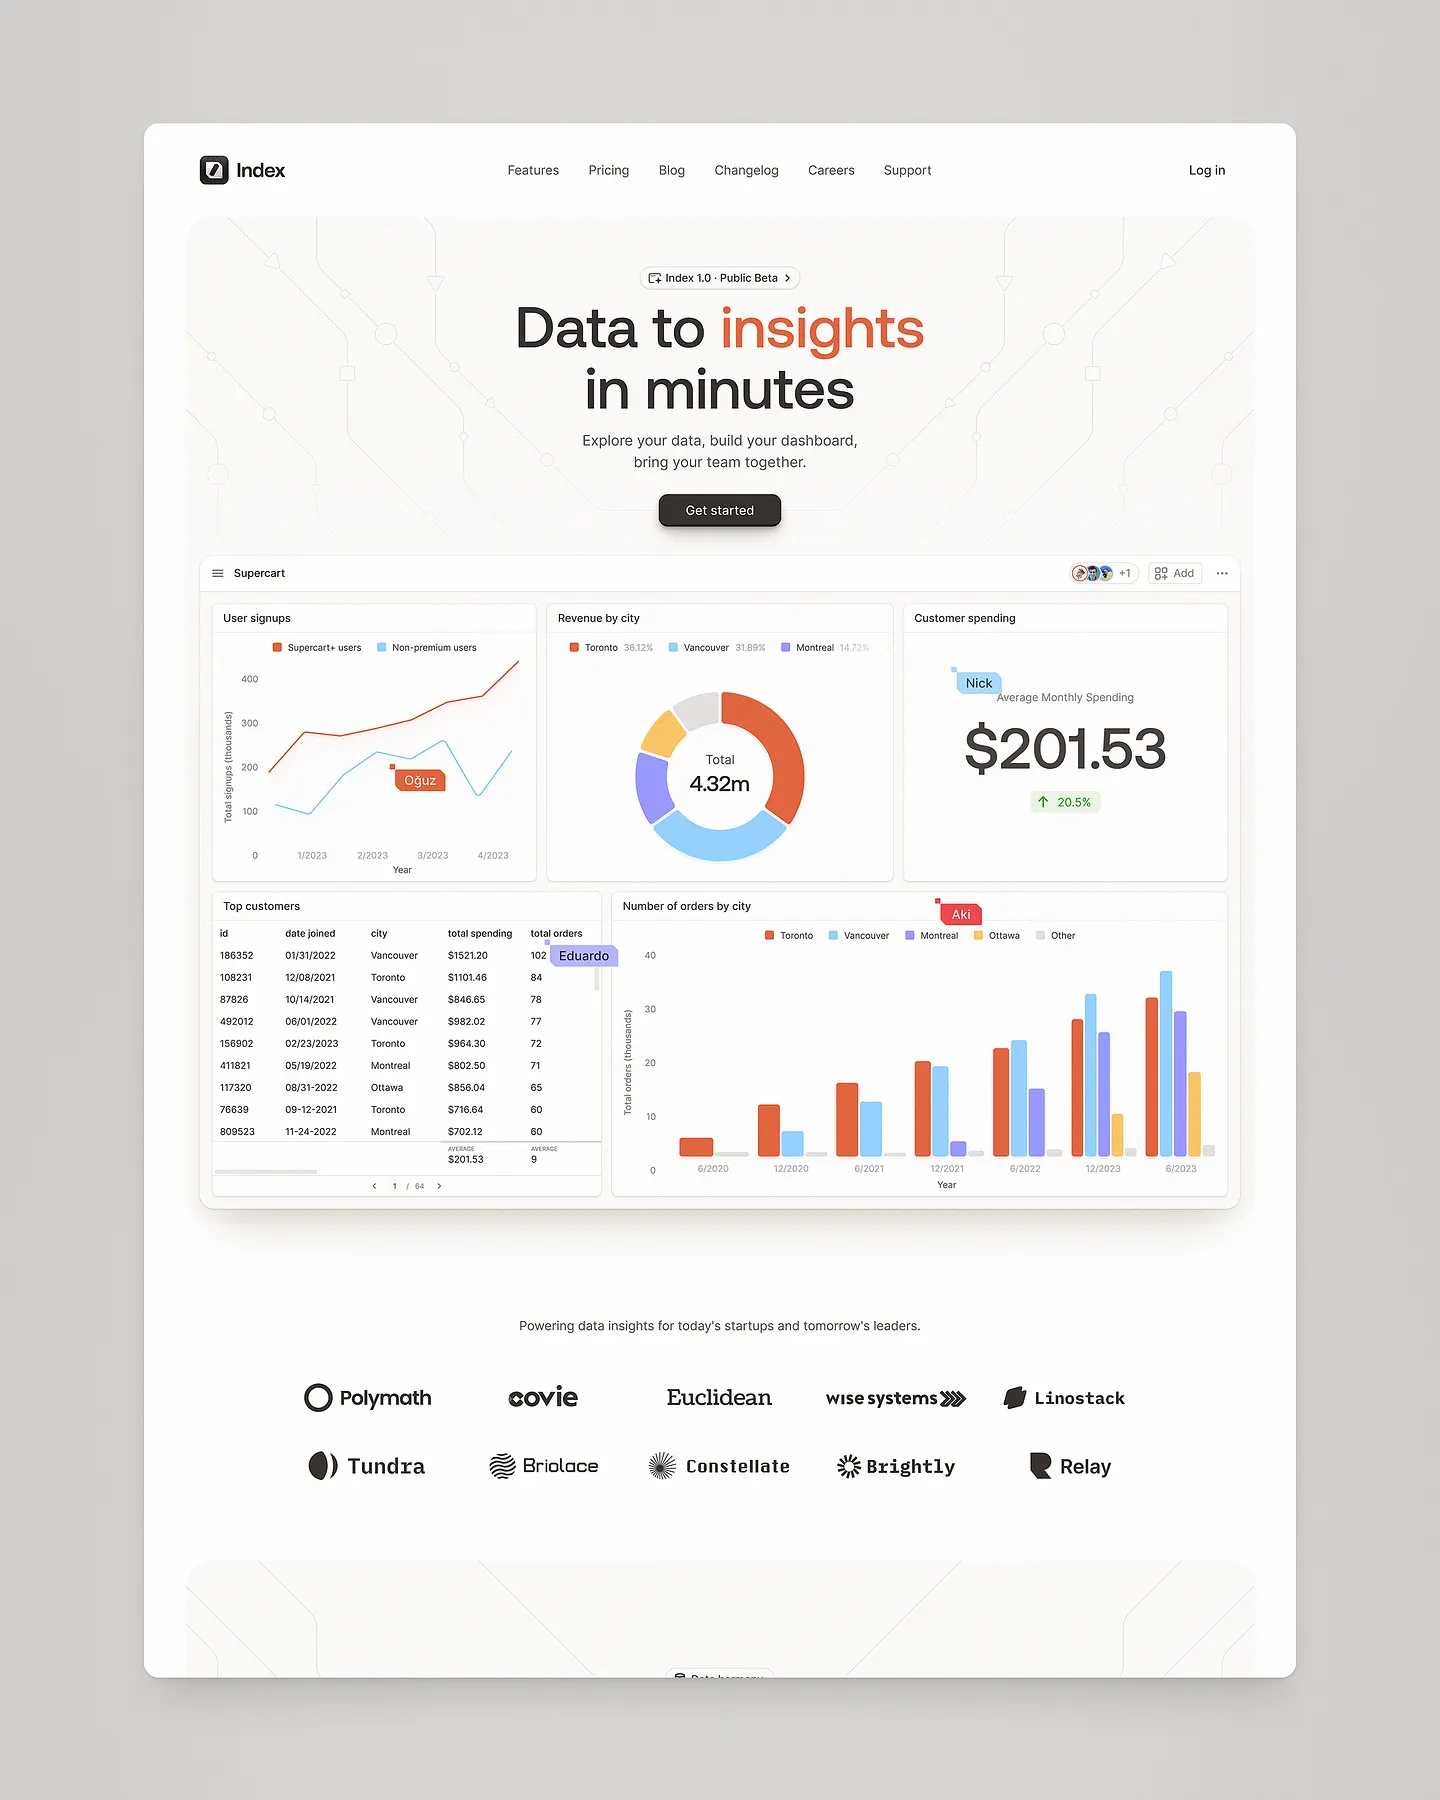
The Index website's graphs page features vibrant charts and intuitive layouts, showcasing user signups, revenue by city, and customer spending. This design makes data analysis accessible and efficient for teams, transforming data into actionable insights in minutes.
Check out this example on Dribbble.

Designers and developers, elevate your Graphs Page with Subframe's drag-and-drop interface and intuitive, responsive canvas. Create pixel-perfect UI effortlessly, loved by professionals for its ease and precision.
Ready to transform your data visualization? Start for free today!
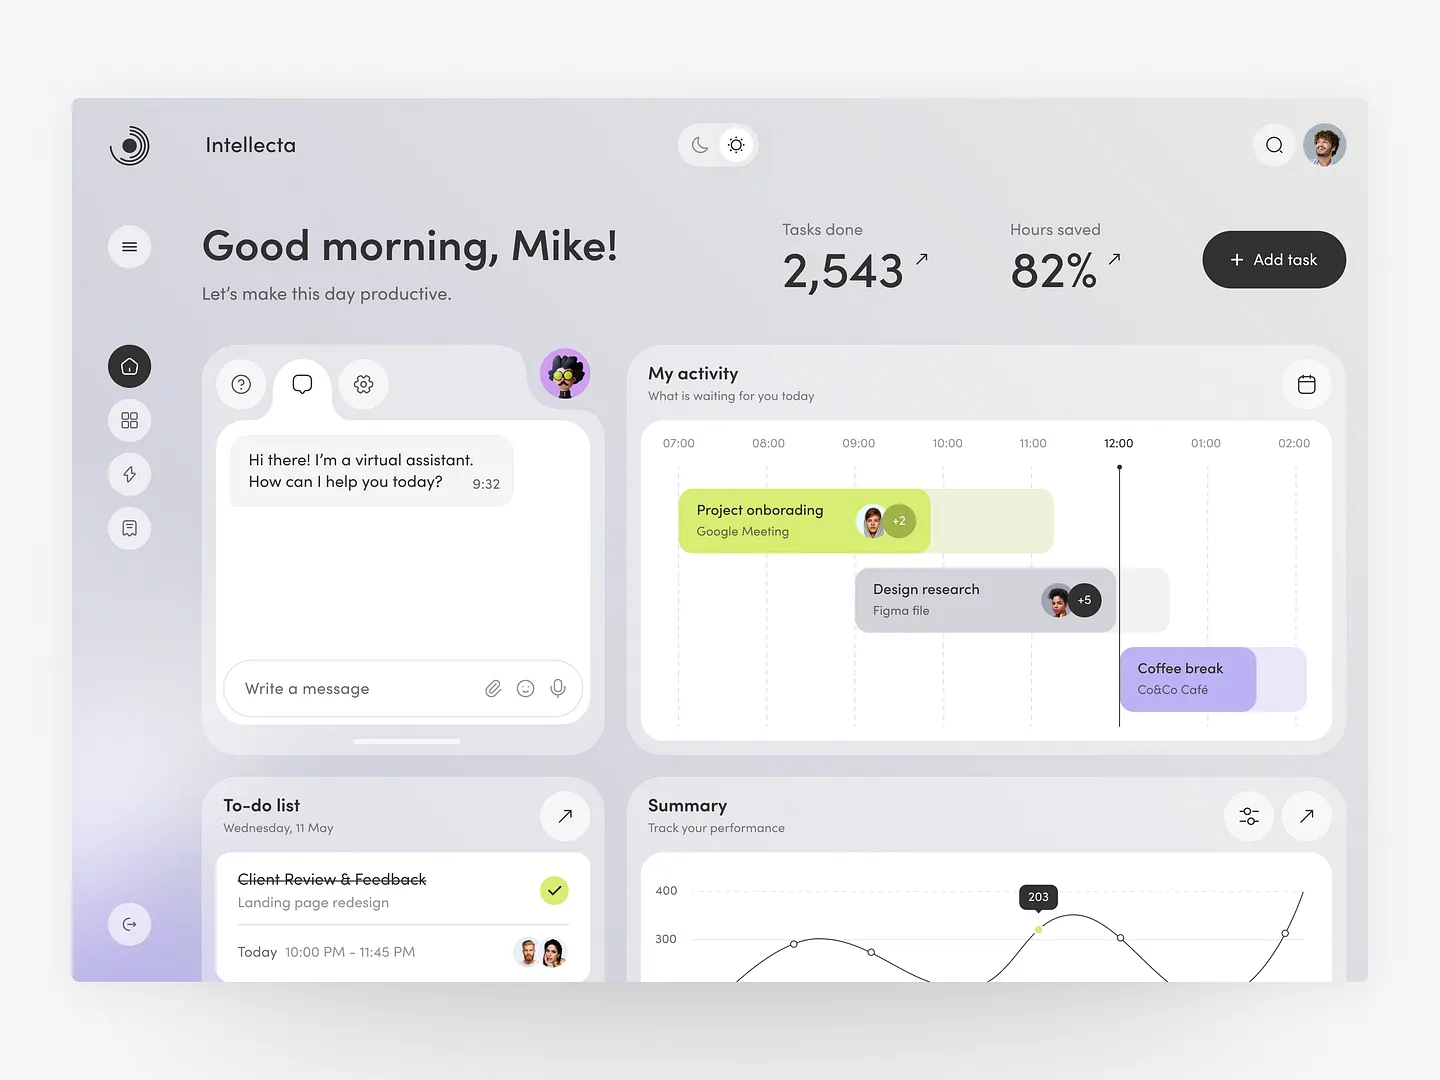
This productivity dashboard features interactive graphs that track performance metrics with soft colors and intuitive layouts. Users can easily visualize tasks completed and hours saved, combining functionality with aesthetic appeal for any productivity-focused application.
Check out this example on Dribbble.
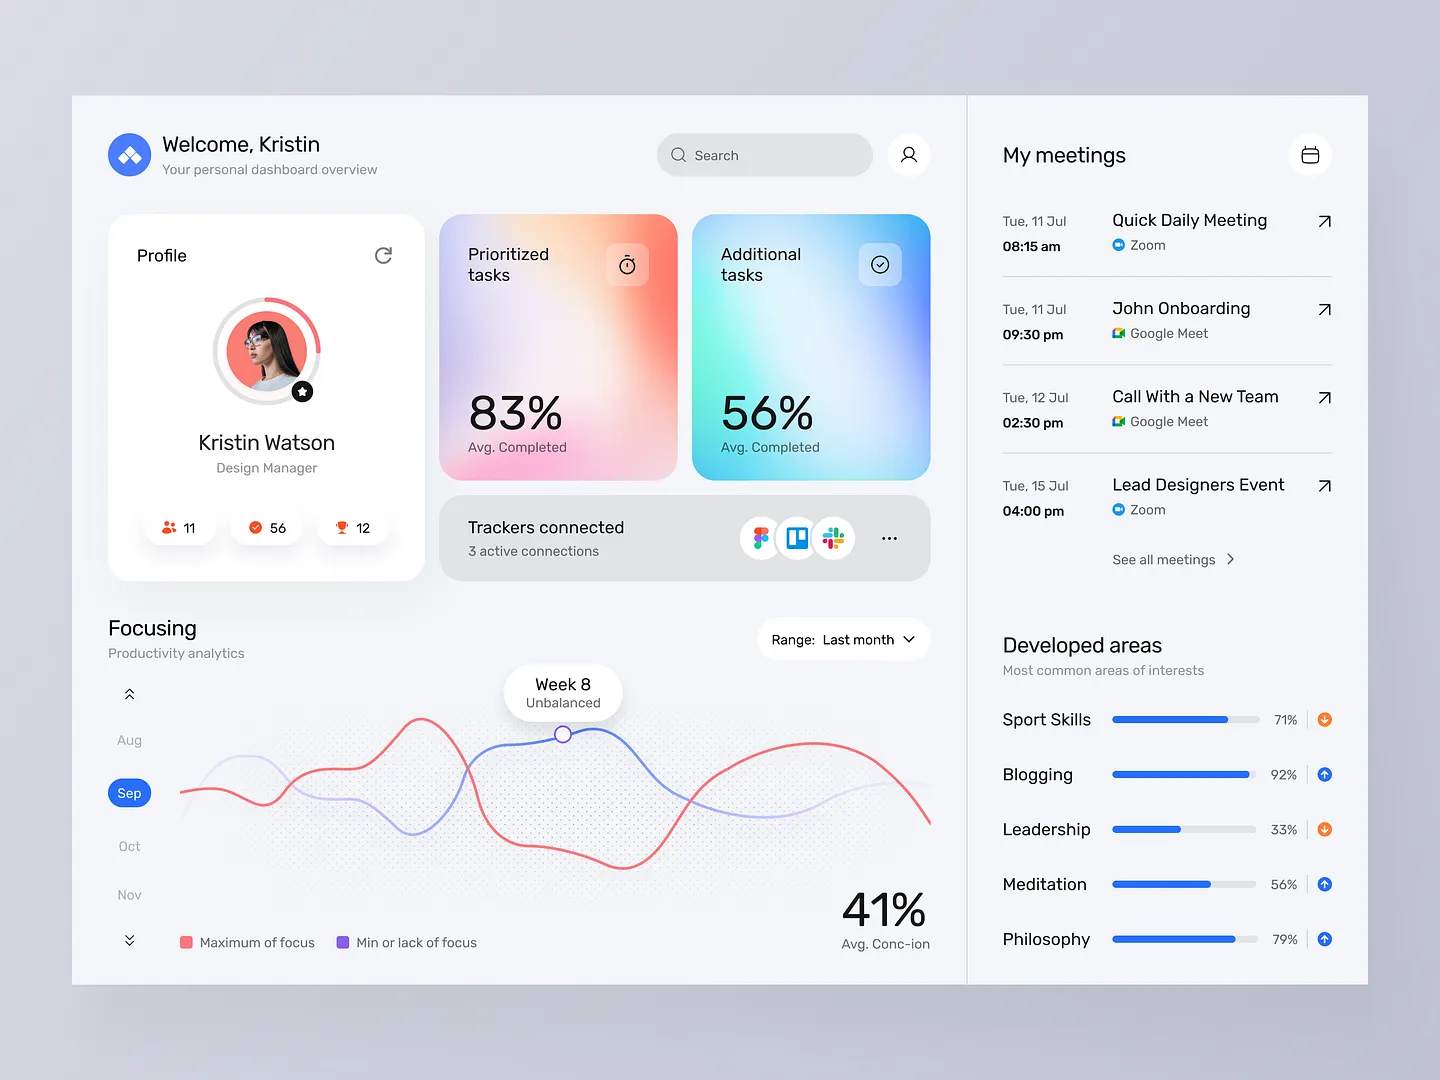
This productivity management graphs page features vibrant visualizations that track task completion and focus levels. Engaging charts and analytics provide insights into performance and areas for improvement, all within a modern, user-friendly interface.
Check out this example on Dribbble.
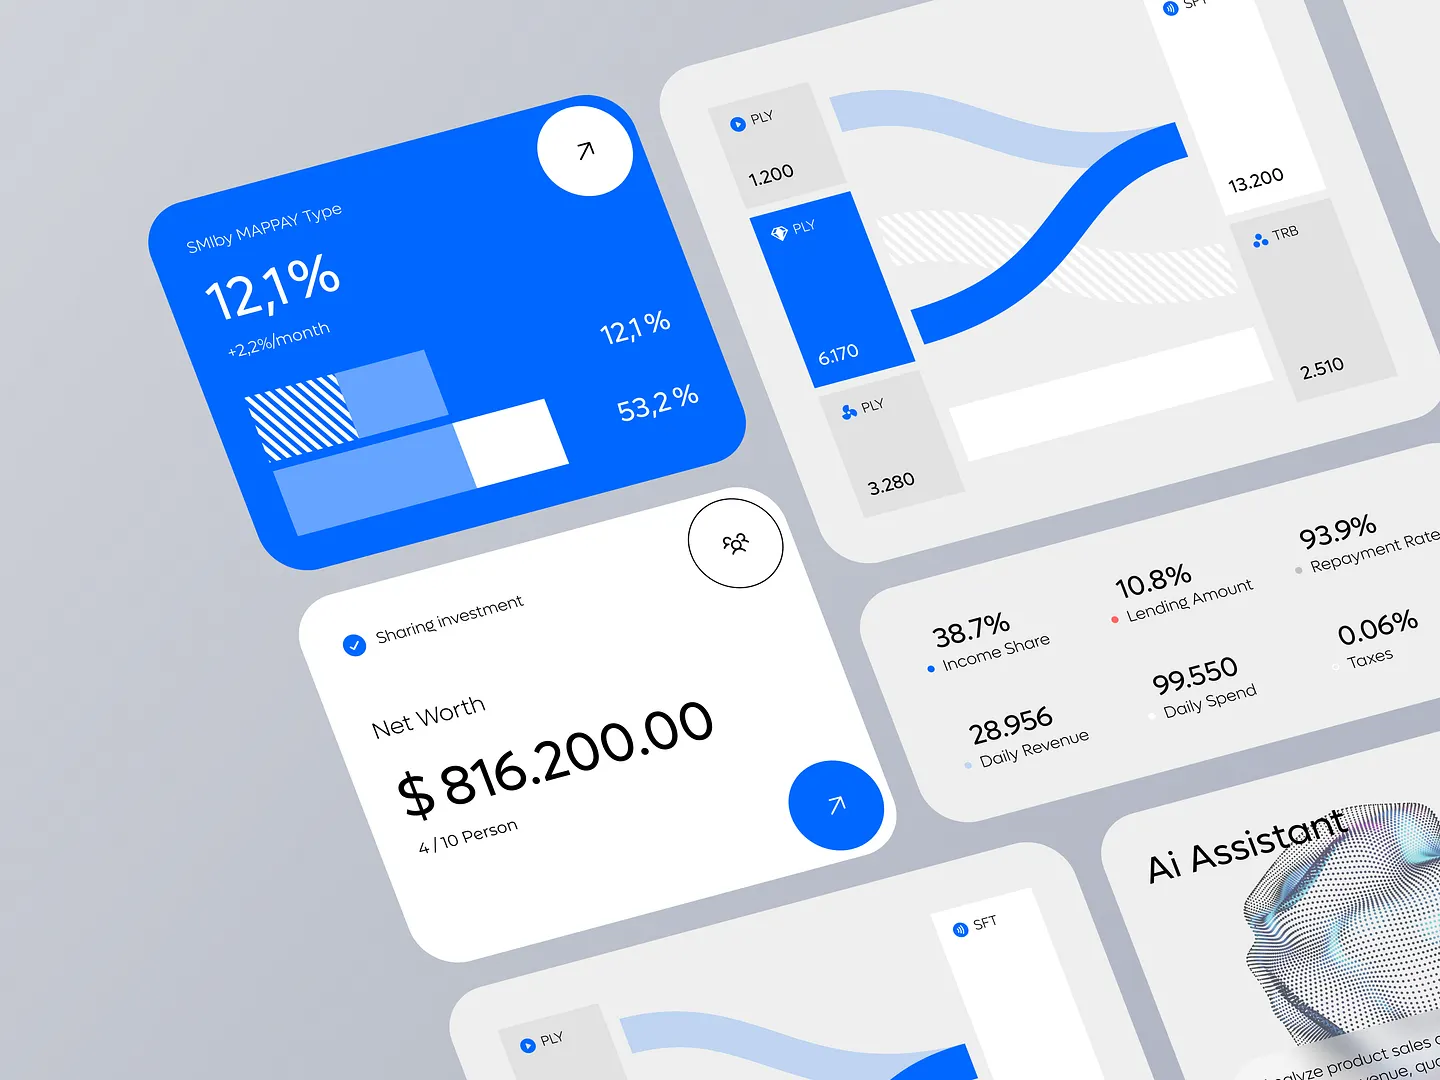
This finance and analytics graphs page features vibrant blue tones, intuitive layouts, and clear data visualizations. It effectively communicates key financial metrics and trends, enhancing user engagement and decision-making. Unique elements include dynamic charts and customizable graphs.
Check out this example on Dribbble.
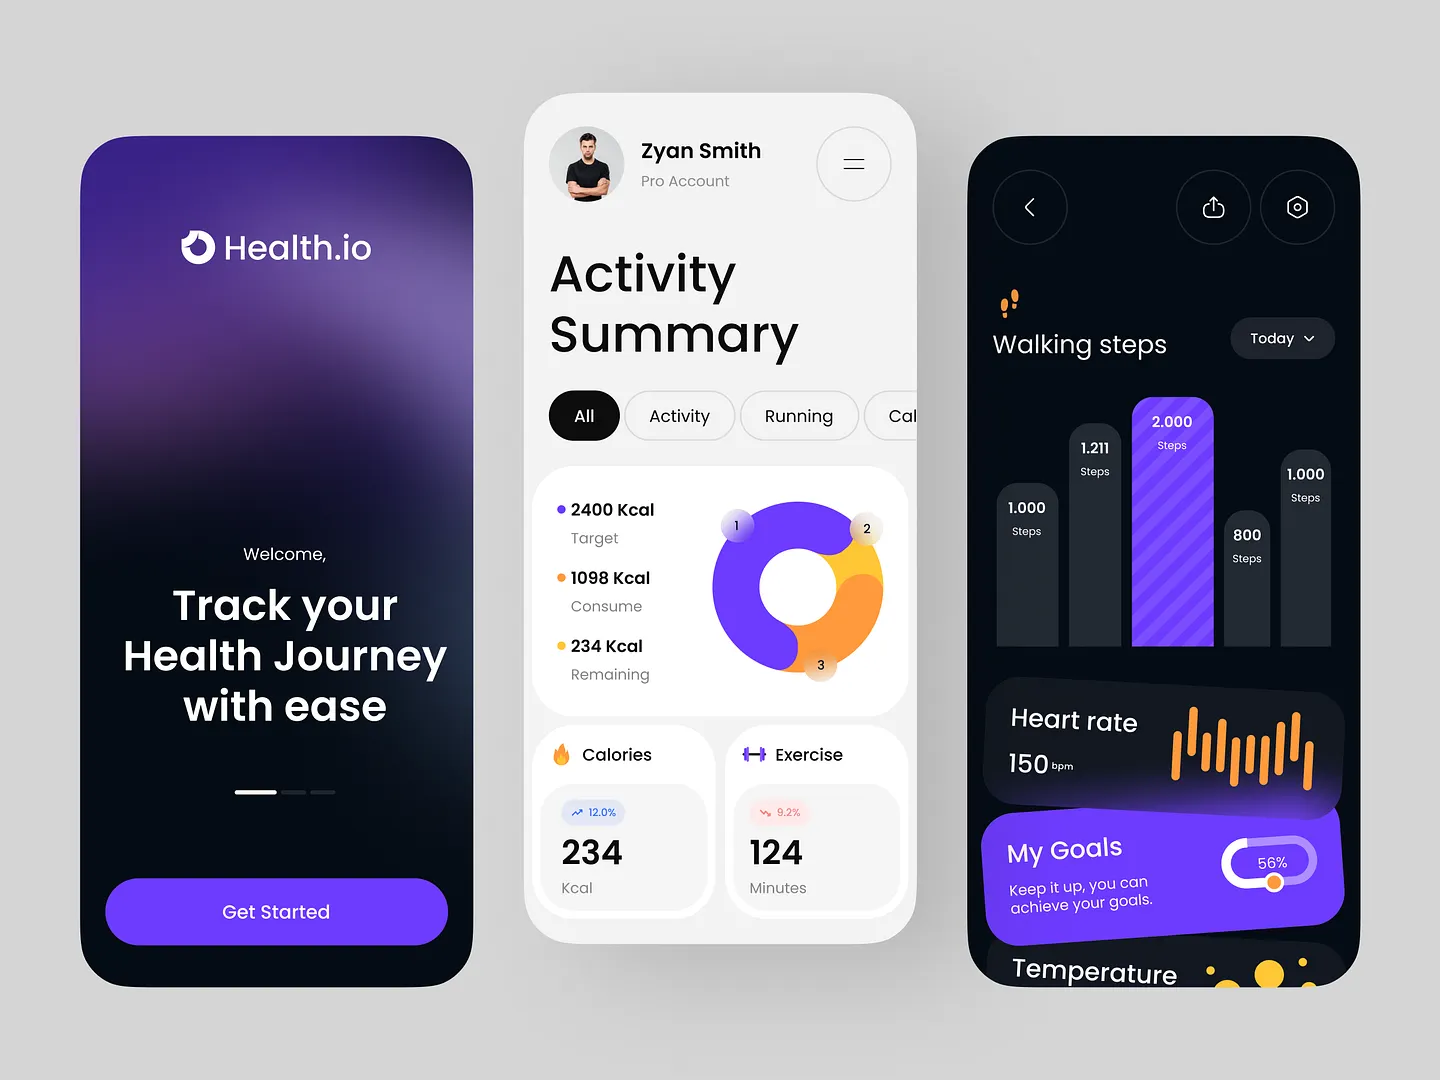
The Health.io app's graphs page features vibrant colors and intuitive layouts, using circular and bar graphs to display user activity and health metrics. This design makes tracking progress and setting goals straightforward and engaging.
Check out this example on Dribbble.
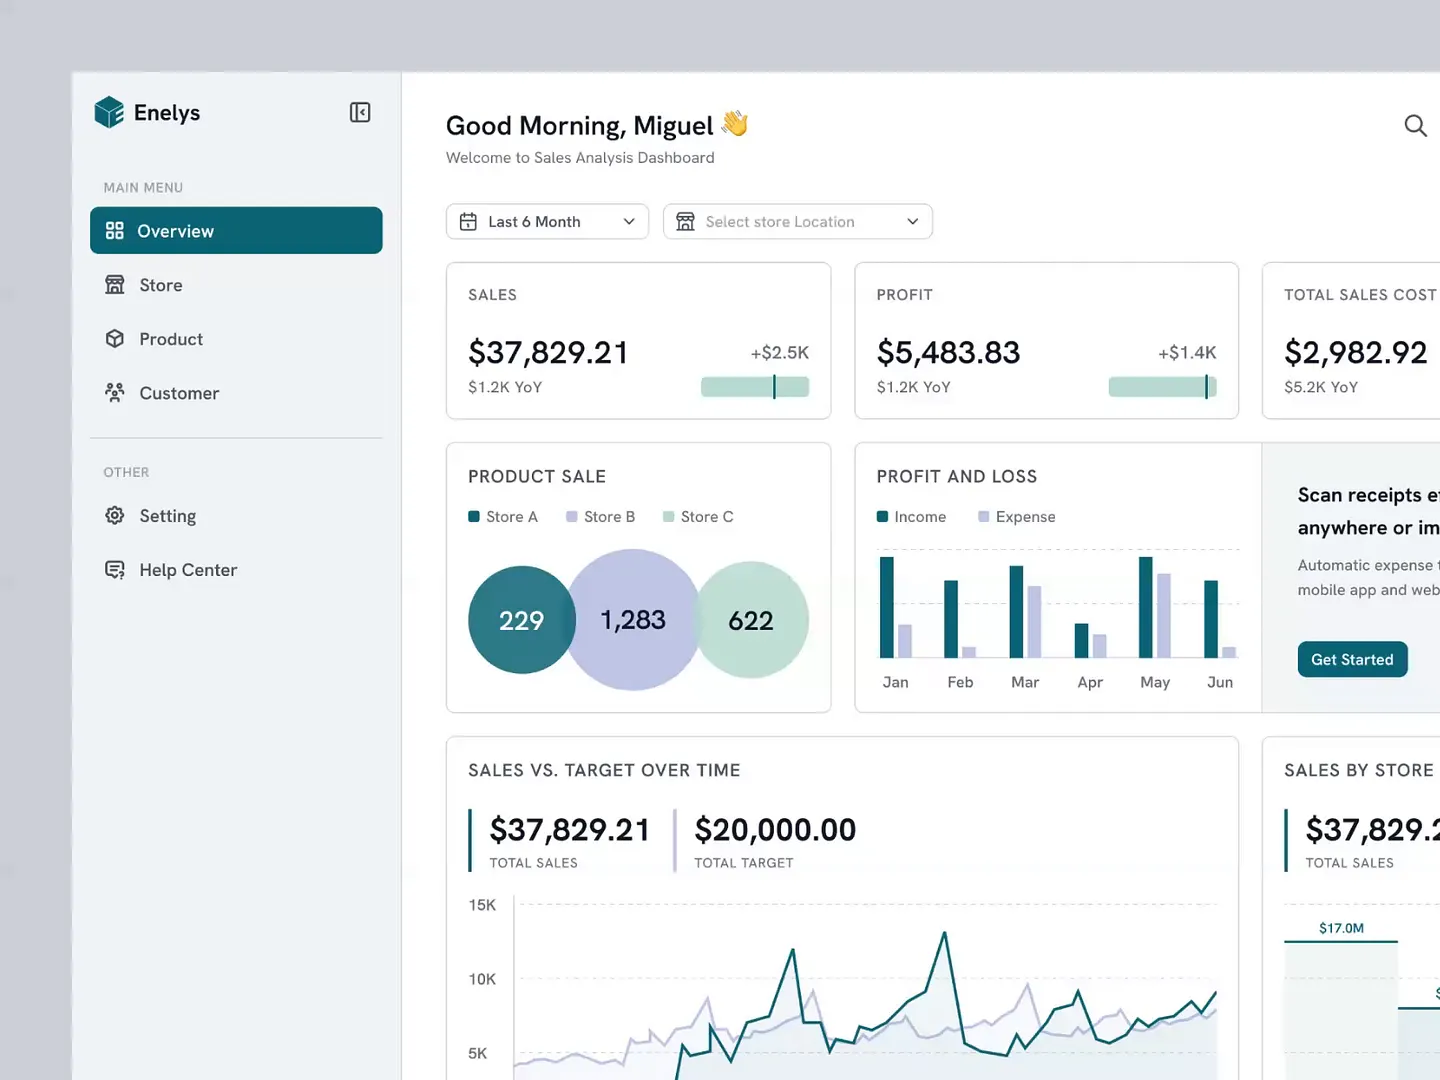
The Enelys Sales Analytic Dashboard features dynamic graphs showcasing key metrics like total sales, profit, and product sales across different stores. Visually engaging charts provide a clear overview of performance trends, making sales data analysis straightforward.
Check out this example on Dribbble.
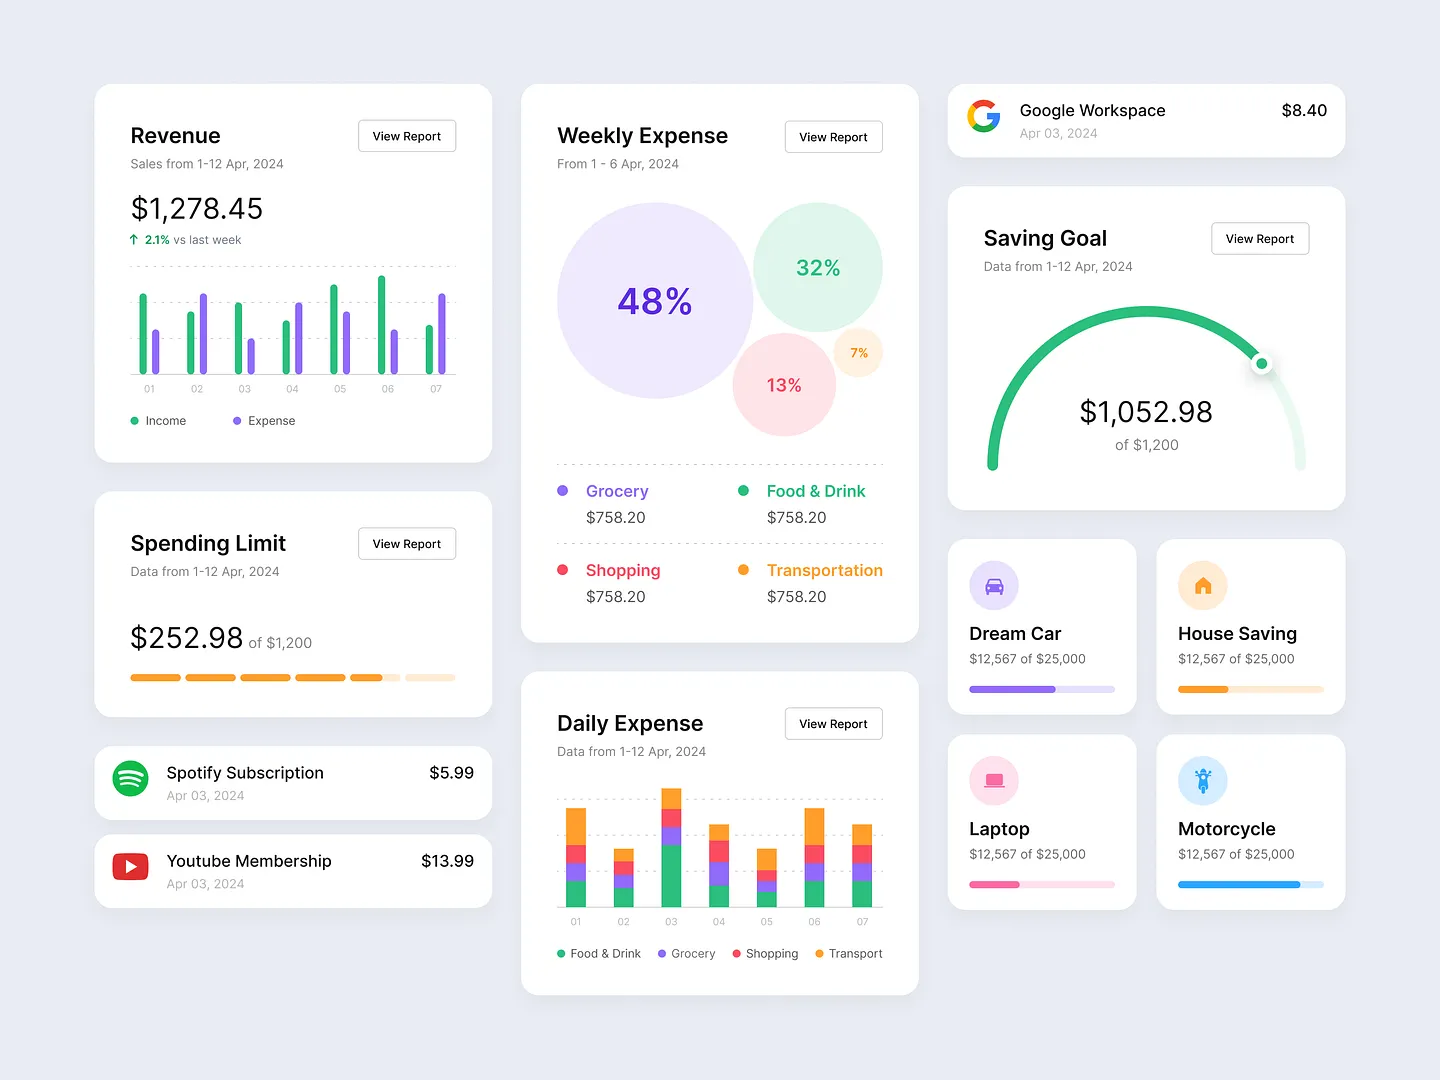
This finance data page features a variety of visually appealing graphs and charts that effectively communicate revenue, expenses, and savings goals. Vibrant colors and clear layouts enhance user engagement, making it easy to track financial performance and spending habits.
Check out this example on Dribbble.
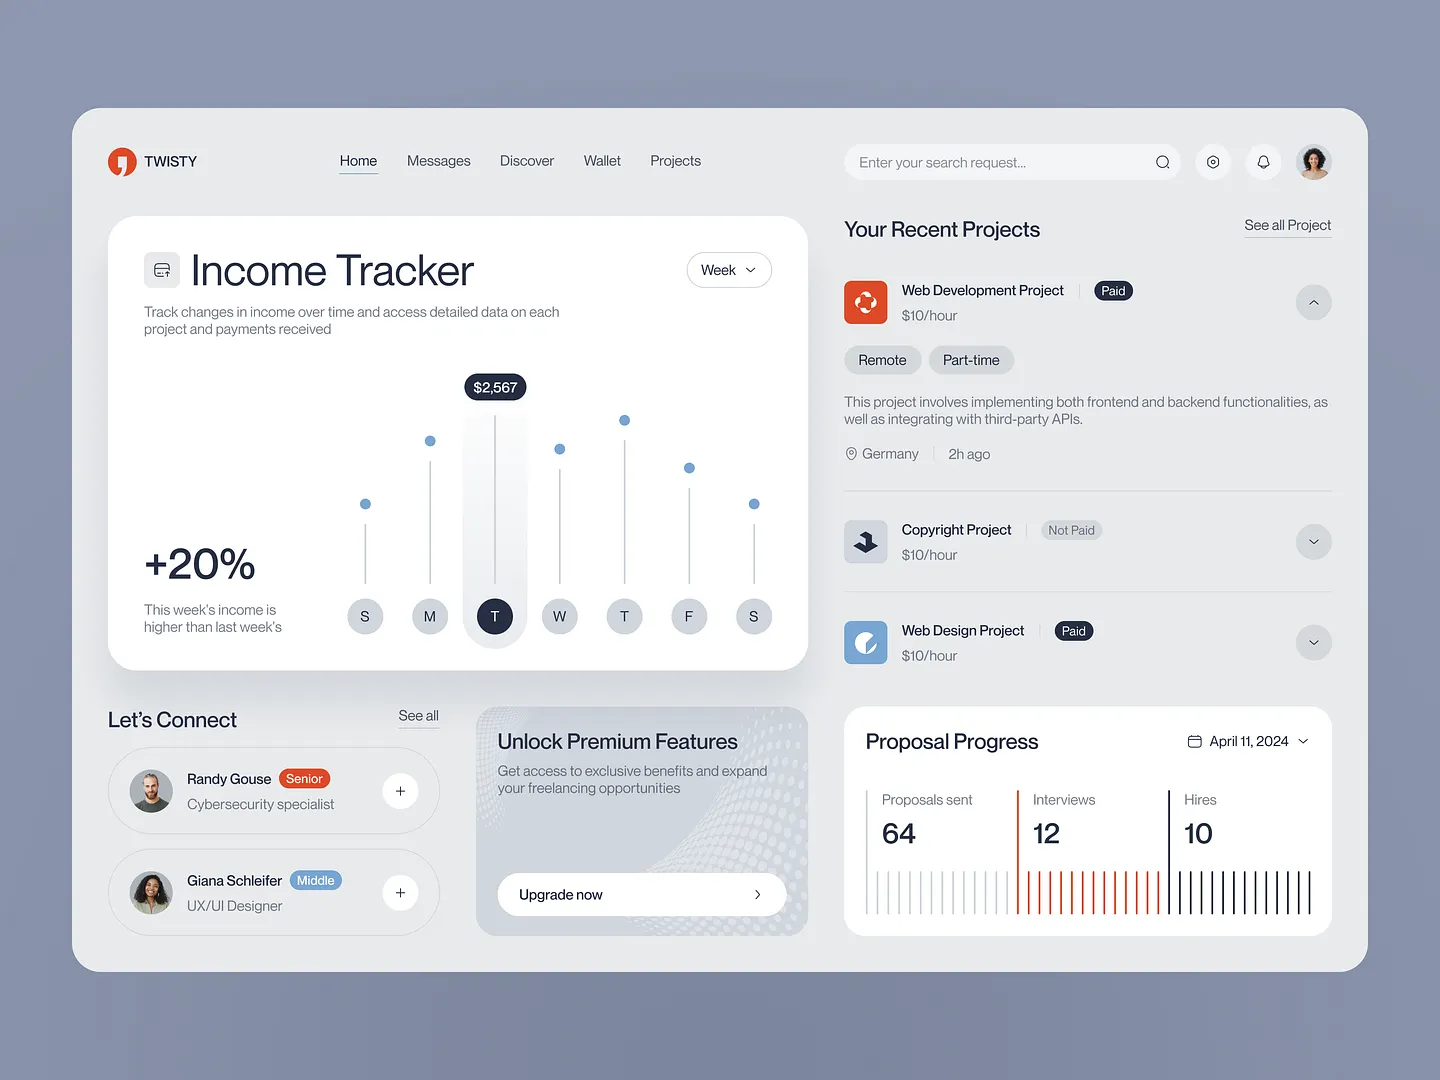
Twisty's finance dashboard features a sleek, user-friendly design that tracks income changes over time. Its modern layout with clear visualizations highlights key metrics and project details, making financial tracking intuitive and engaging.
Check out this example on Dribbble.
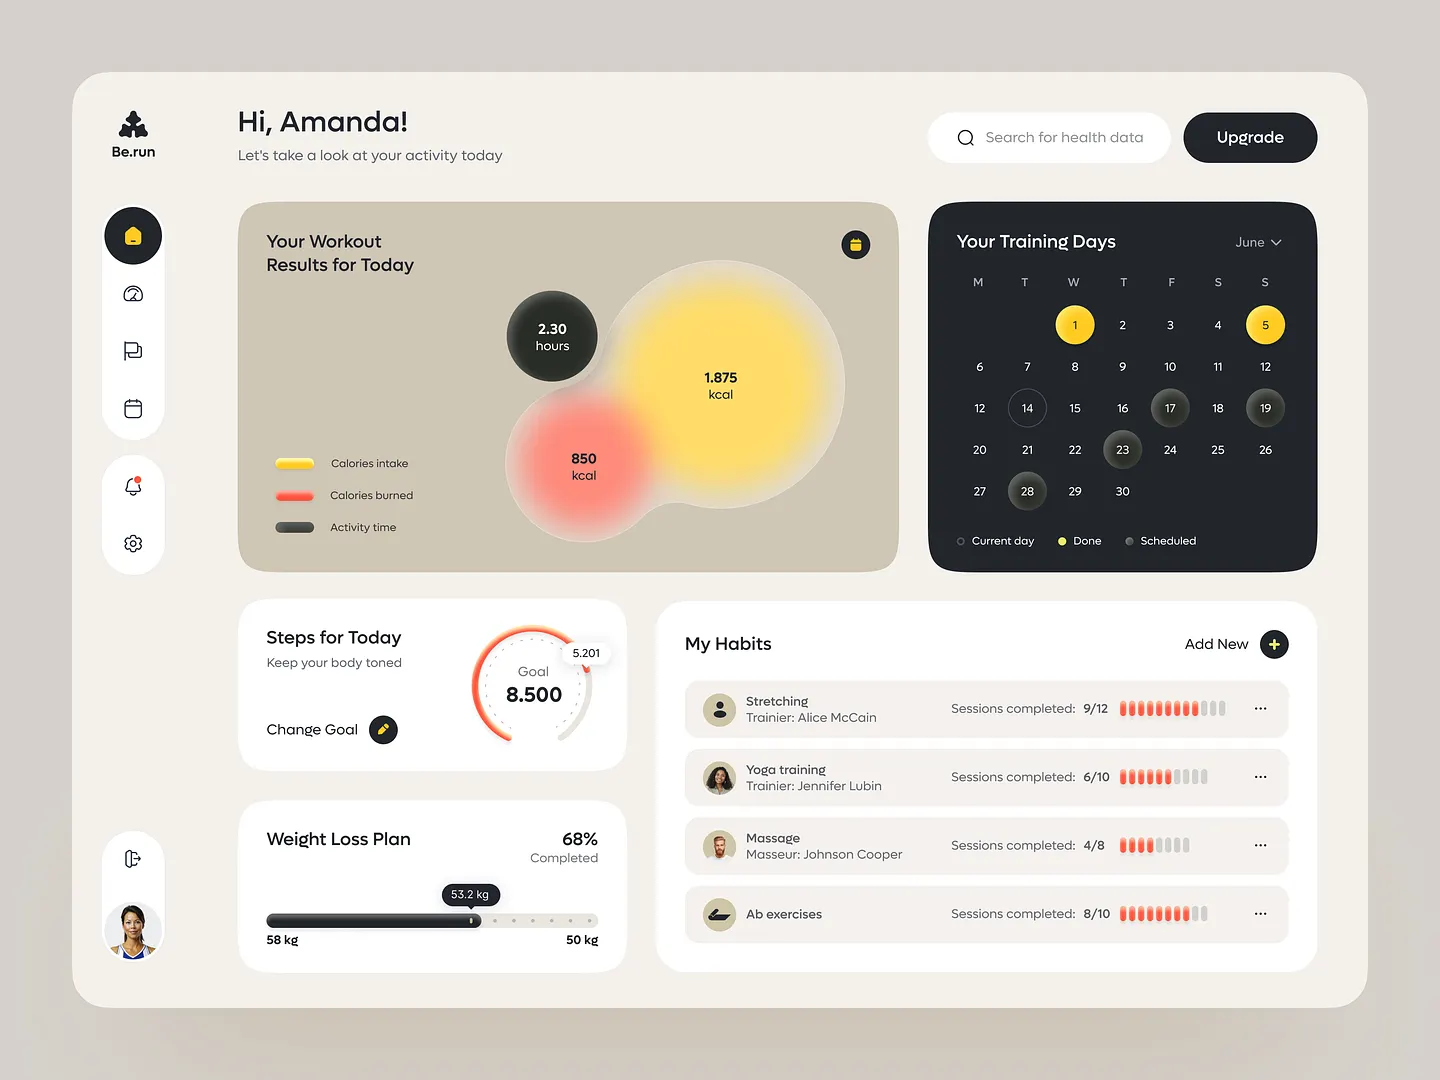
The BeRun fitness app's dynamic graphs page showcases daily workout results, calorie intake, and activity levels. Its sleek design features vibrant visuals and intuitive layouts, making it easy to track fitness progress and set goals effectively.
Check out this example on Dribbble.

The Attio – Reporting 2.0 graphs page features vibrant visualizations like sales pipelines, demographic breakdowns, and subscription trends. Its clean layout and intuitive design elements enhance data interpretation and decision-making, making navigation and insight extraction effortless.
Check out this example on Dribbble.
Ready to design your own Graphs Page? Subframe streamlines the process with its intuitive interface and responsive canvas, making it easy to achieve professional, pixel-perfect results quickly.
Elevate your data visualization effortlessly. Start for free today!
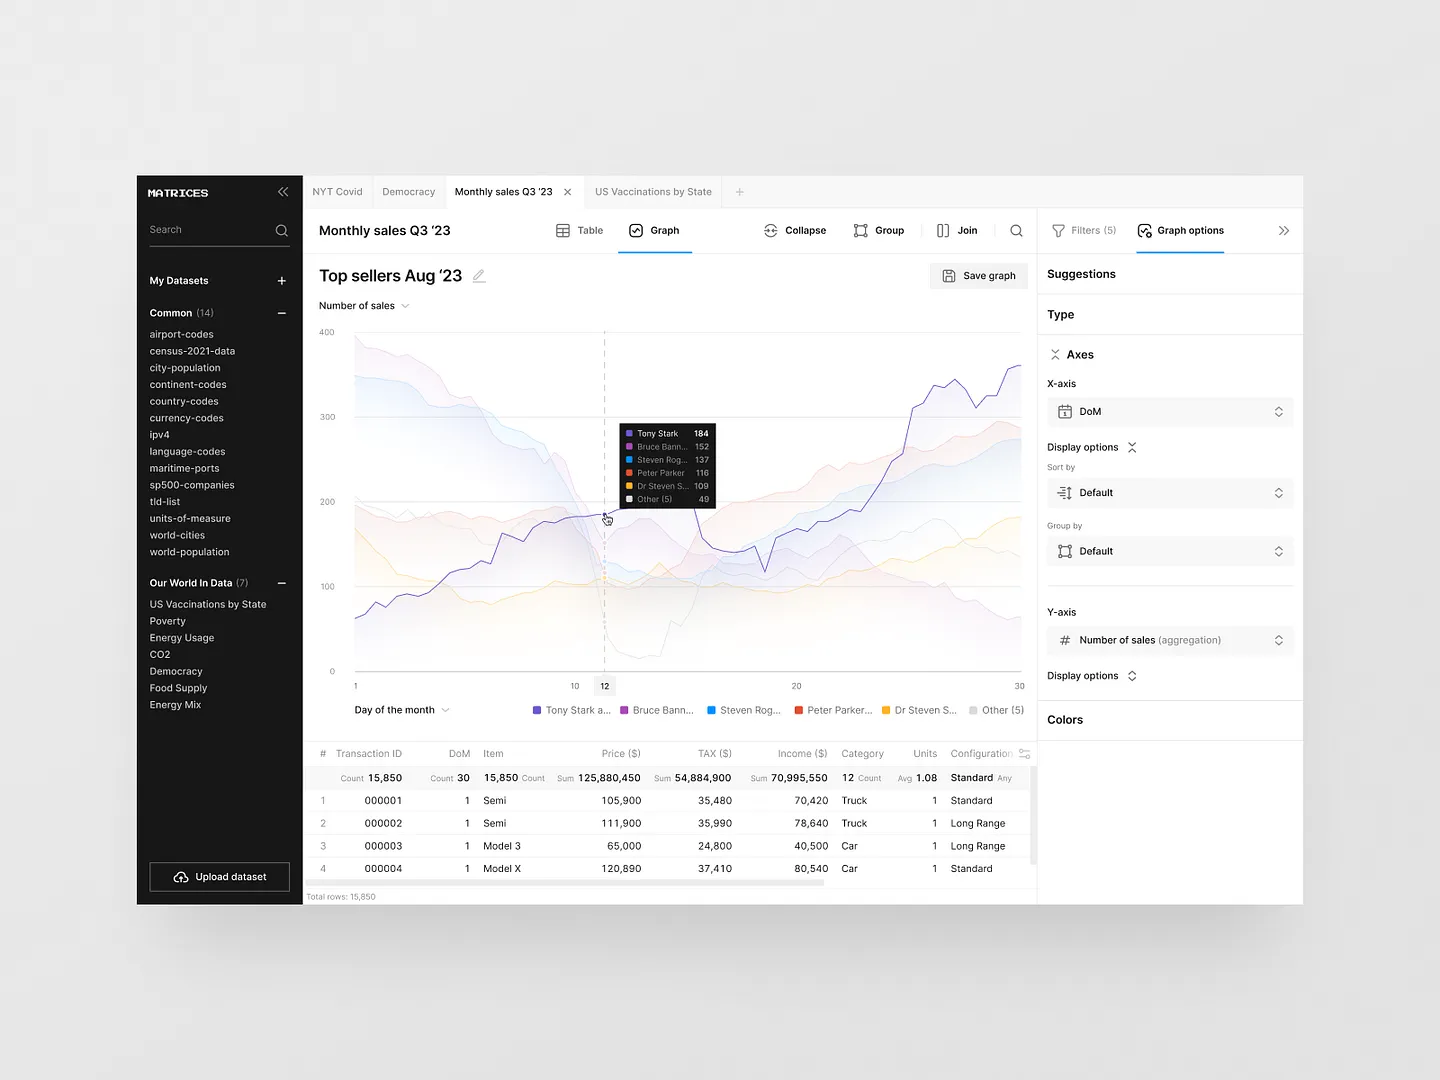
This dynamic graphs page for visualizing monthly sales data features a clean layout with interactive elements. Users can analyze trends through various graph options, colors, and data filters, enhancing the overall data interpretation experience. Unique features include customizable data filters and vibrant color schemes that make data analysis intuitive and engaging.
Check out this example on Dribbble.
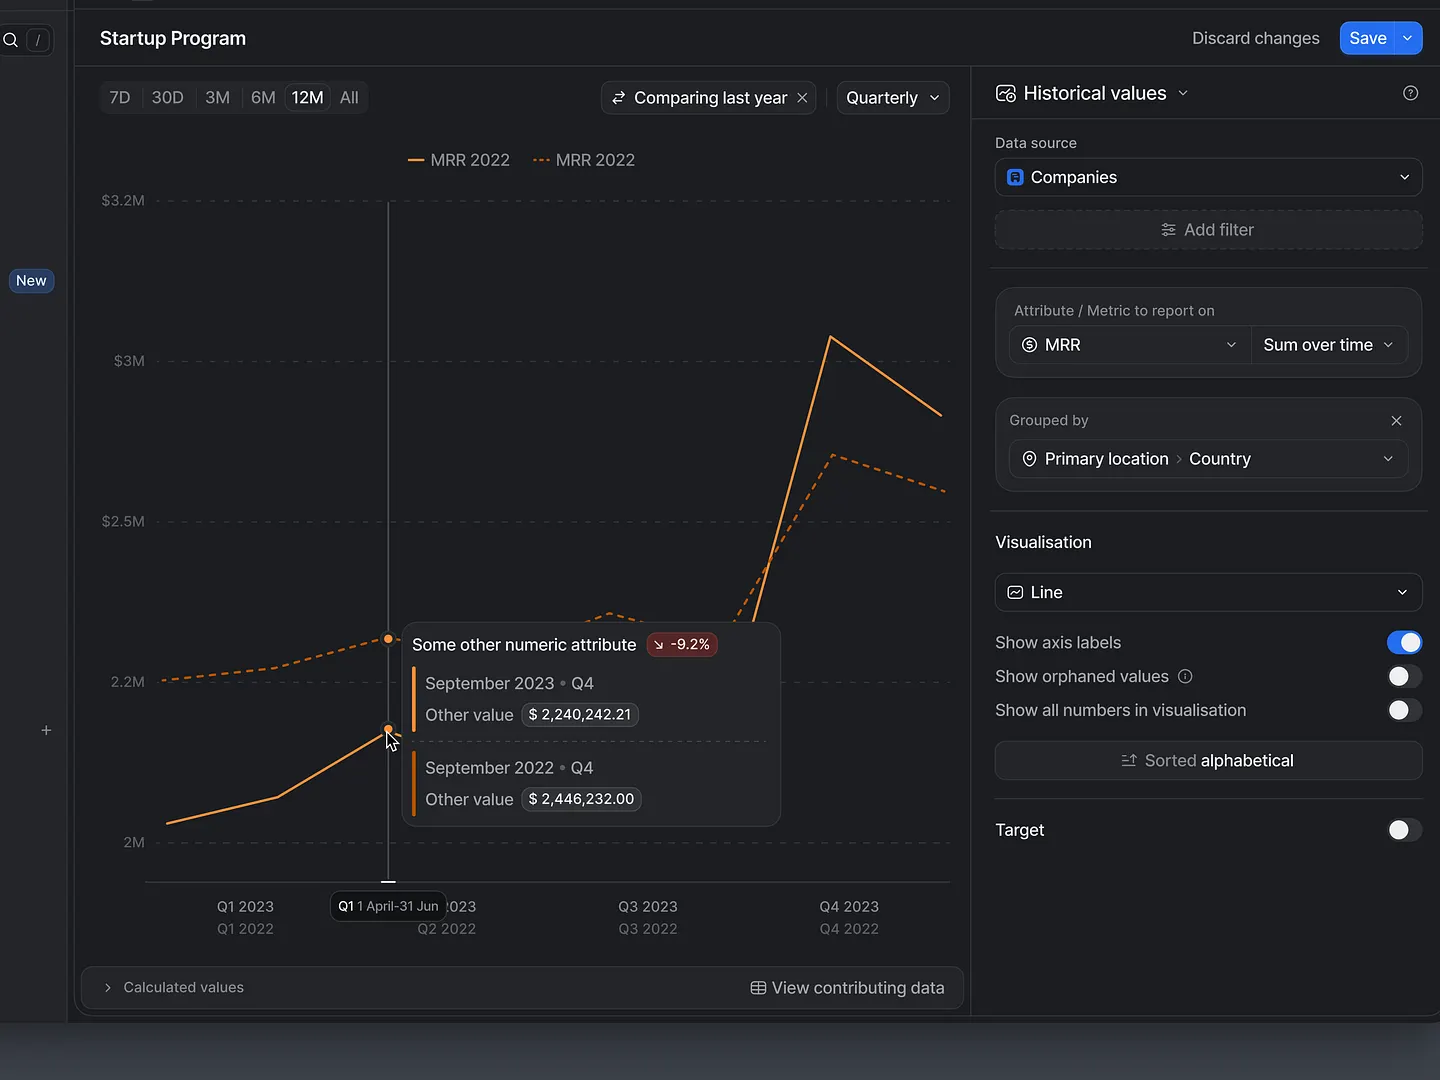
This design showcases a line graph comparing monthly recurring revenue (MRR) over time, highlighting key trends and fluctuations. Contrasting colors and clear labels enhance readability, making it an essential tool for data-driven decision-making.
Check out this example on Dribbble.

The Contentium landing page features a sleek, dark theme that enhances data visualization visibility. Its modern layout integrates graphs and metrics, showcasing total traffic and performance analytics, making it an essential tool for managing content with AI.
Check out this example on Dribbble.
The Contentium landing page features a sleek, dark theme that enhances data visualization visibility. Its modern layout integrates graphs and metrics, showcasing total traffic and performance analytics, making it an essential tool for managing content with AI.
Check out this example on Dribbble.
This finance management graphs page features intuitive layouts and vibrant blue tones, emphasizing user engagement with interactive financial charts and clear data visualizations. Unique elements include customizable data filters and dynamic charts that simplify tracking and analyzing financial performance.
Check out this example on Dribbble.
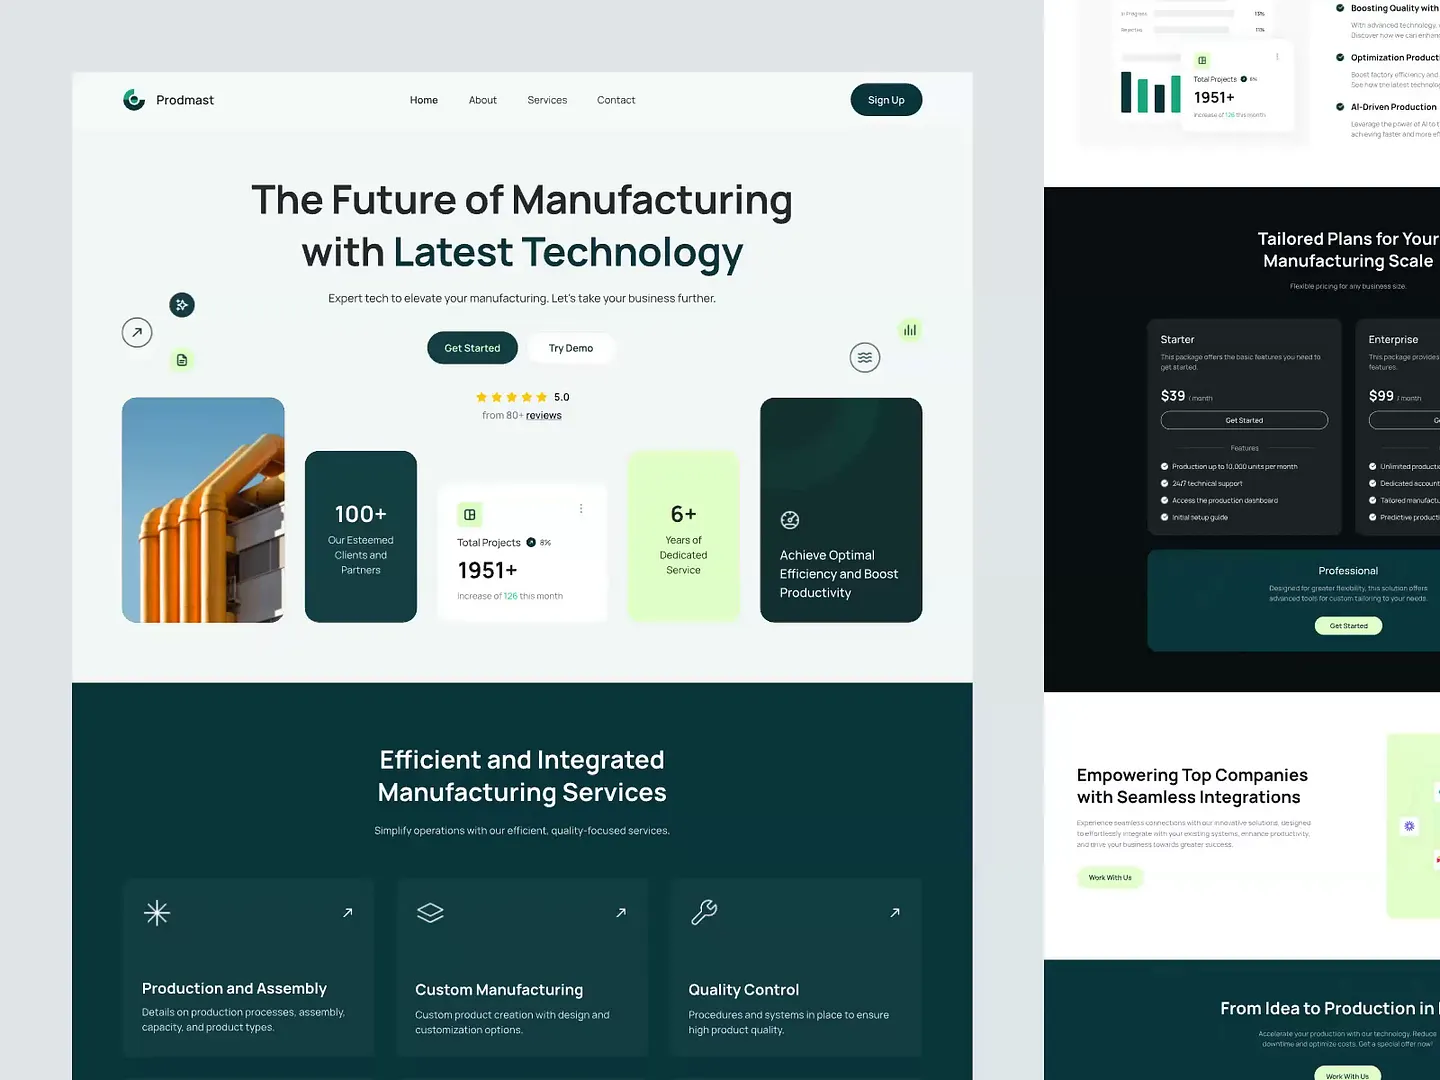
This manufacturing graphs page design features dynamic data visualizations, a clean layout, and a cohesive color palette. It effectively communicates key metrics and project statistics, enhancing user engagement and understanding. Unique elements include interactive charts and customizable data filters.
Check out this example on Dribbble.
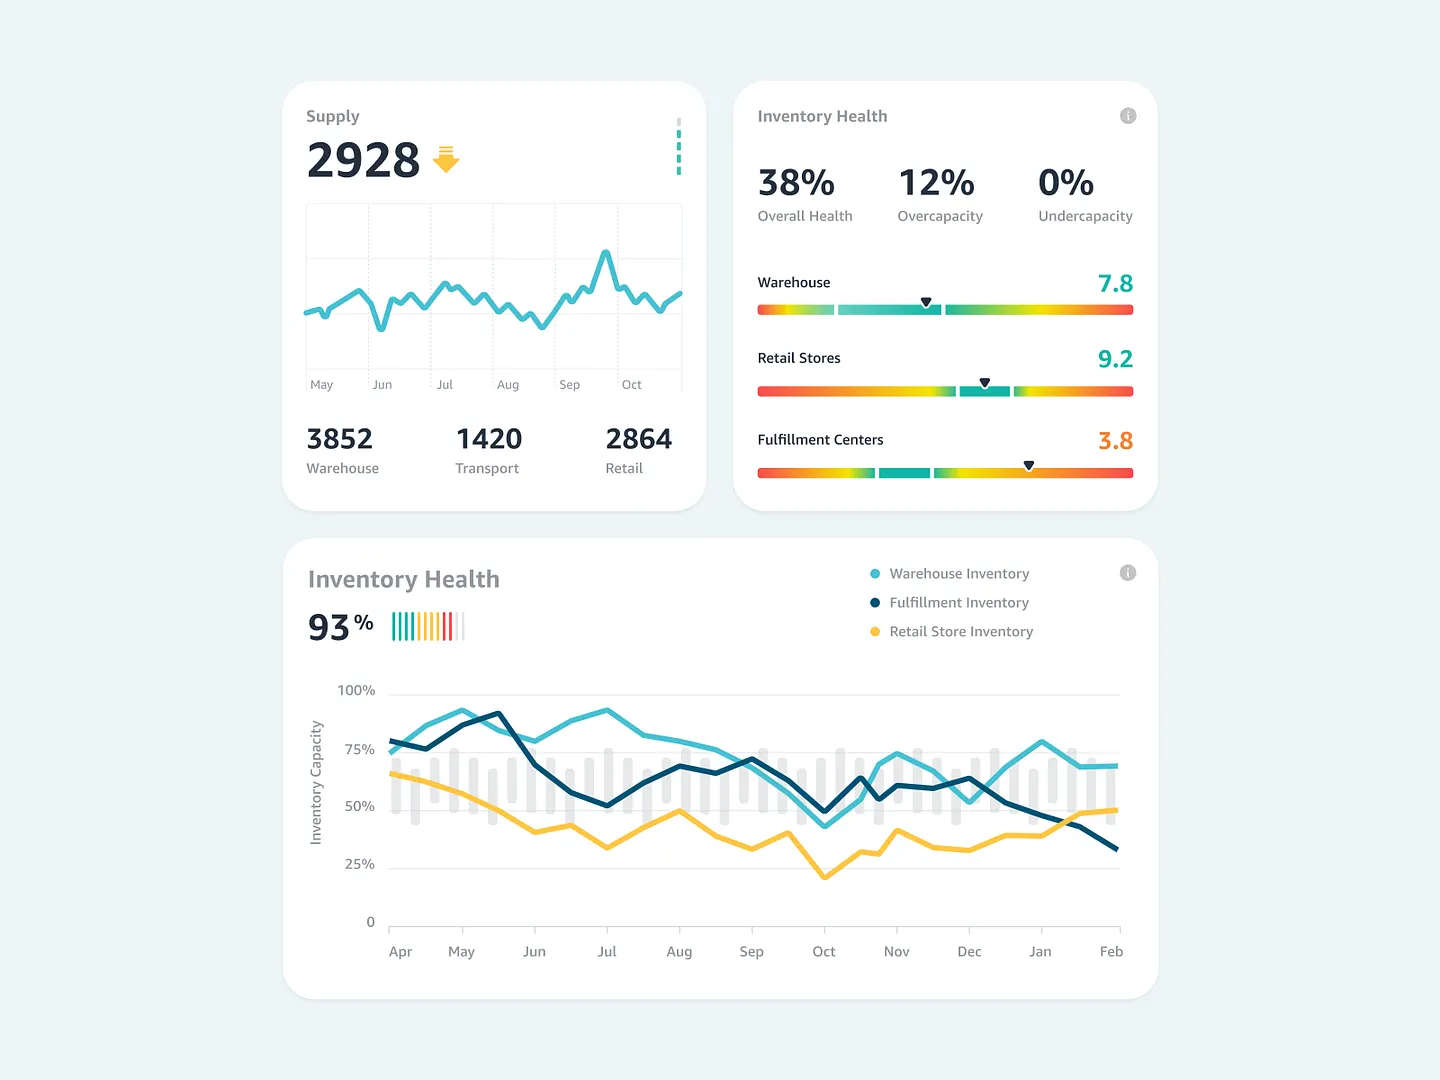
This design features visually engaging graphs that provide insights into inventory health and supply metrics. Clear data visualizations showcase supply trends and inventory capacity, using a harmonious color palette to enhance readability and understanding. Unique elements include interactive charts and customizable data filters.
Check out this example on Dribbble.
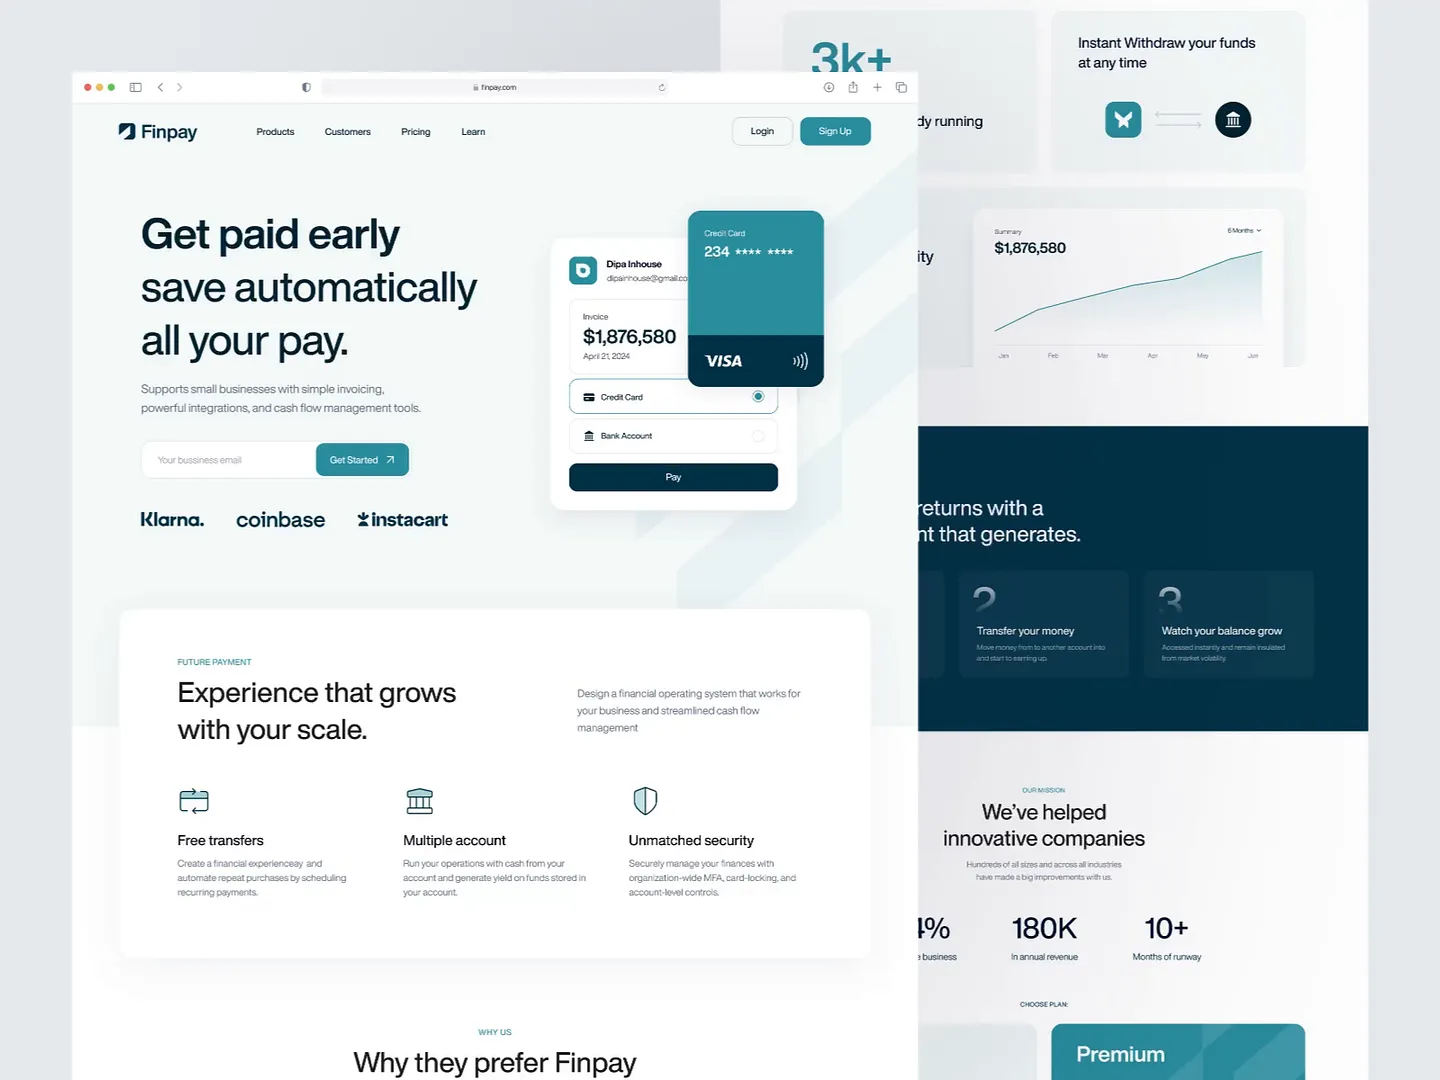
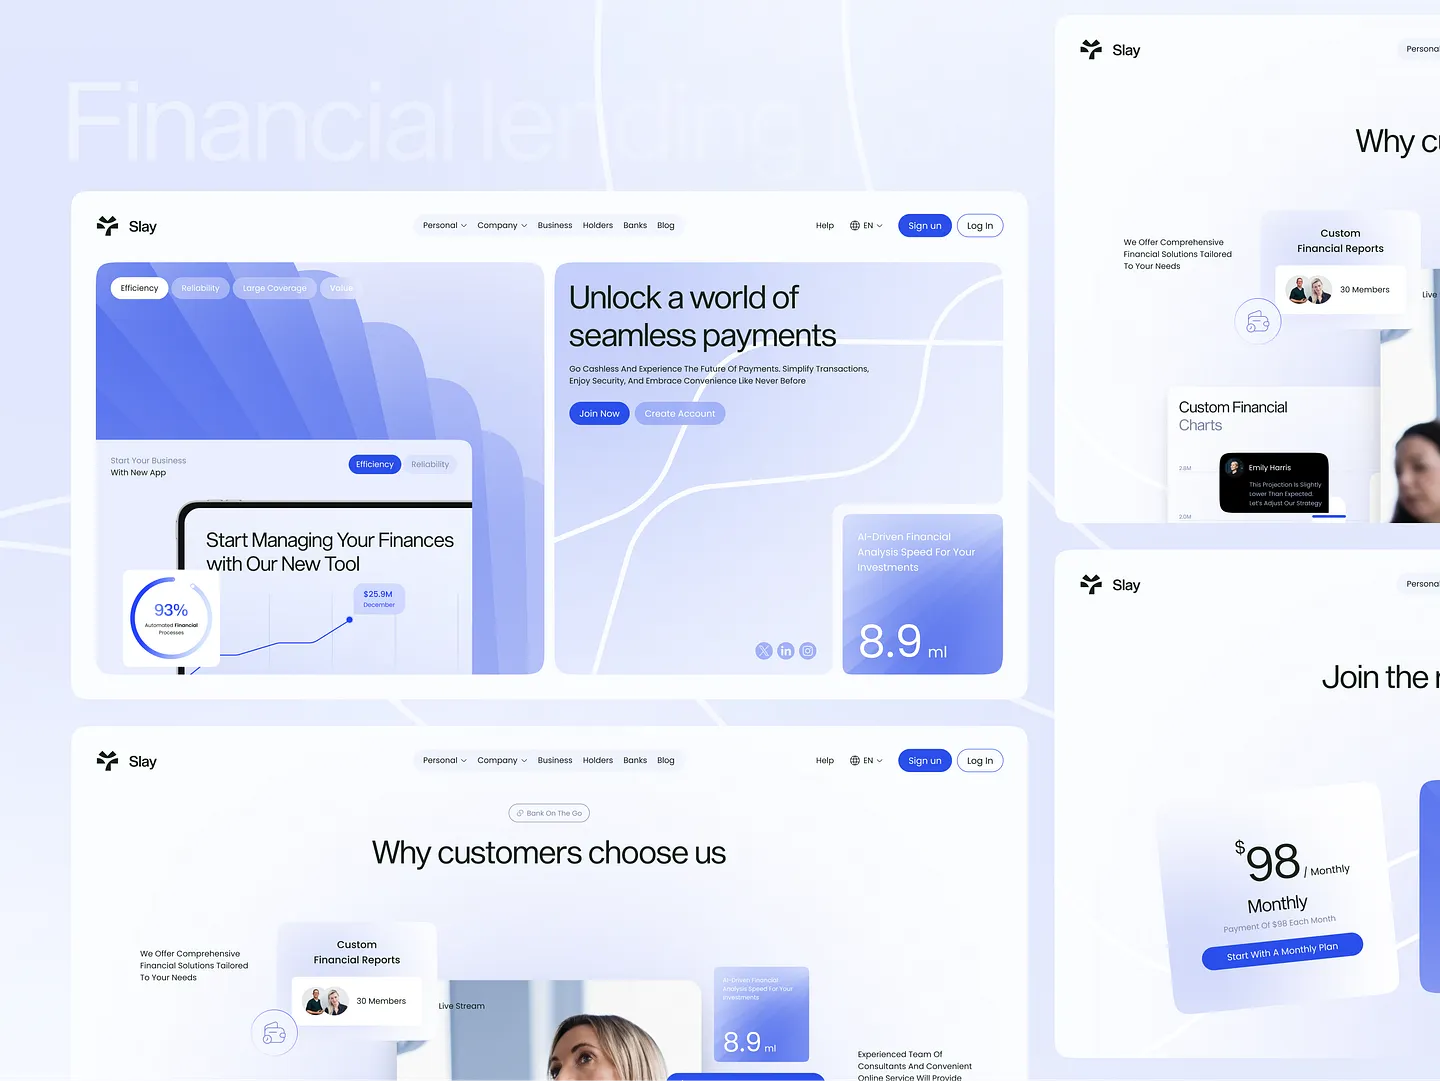
The Finpay graphs page features a sleek, modern design with dynamic data visualizations that boost user engagement. Its clean layout, contrasting colors, and intuitive navigation make tracking financial growth and performance metrics straightforward and engaging.
Check out this example on Dribbble.
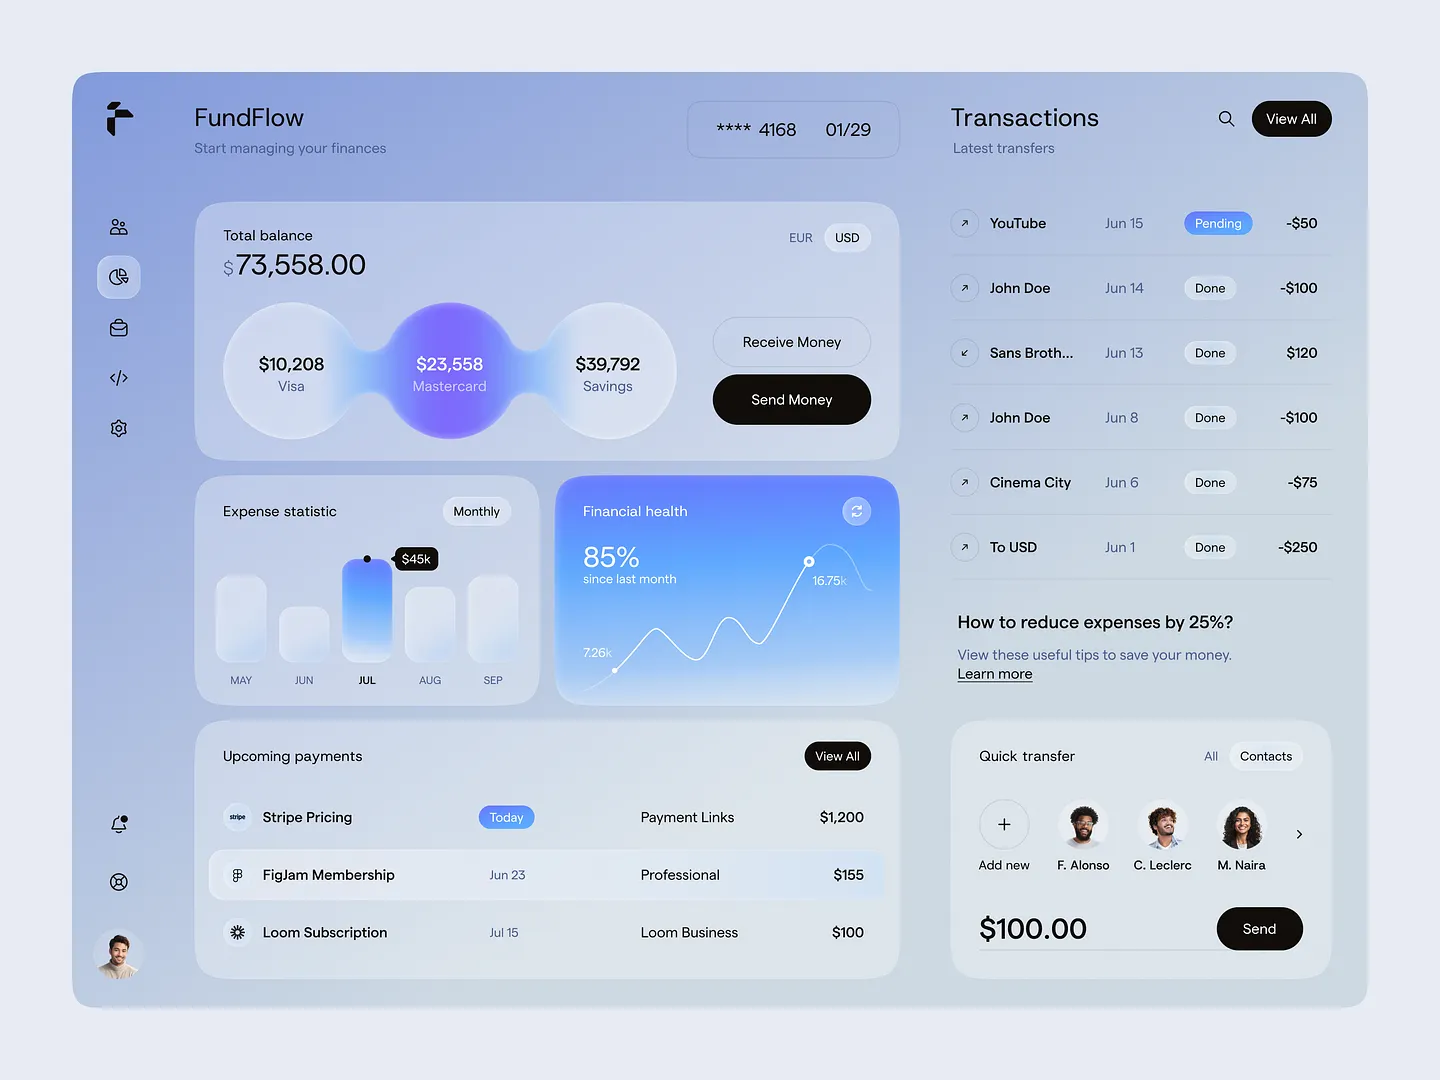
The FundFlow finance dashboard features dynamic financial health metrics and expense statistics, presented in a sleek design with a modern color palette. Its intuitive layout makes tracking monthly expenses and visualizing financial trends straightforward. Unique elements include interactive charts and customizable data filters.
Check out this example on Dribbble.
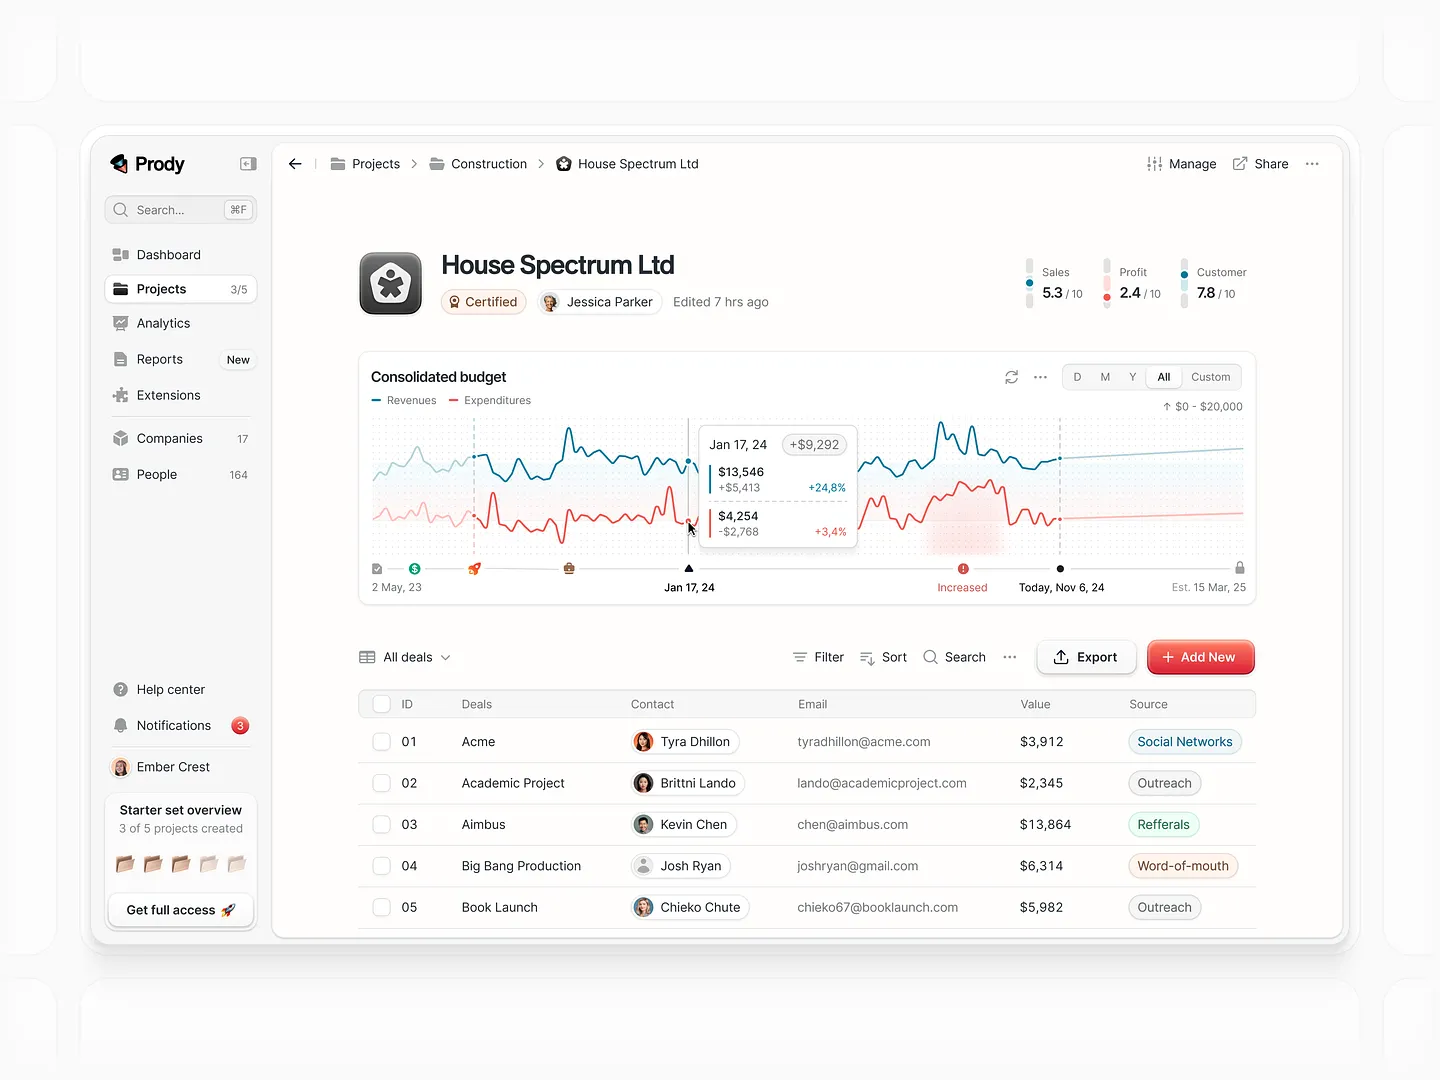
This dynamic graphs page for project management offers real-time budget tracking and performance metrics. It visualizes revenues, expenditures, sales, and profit ratings, providing a comprehensive overview for informed decision-making and optimized project outcomes. Unique features include interactive charts and customizable data filters.
Check out this example on Dribbble.
In conclusion, designing a compelling Graphs Page is essential for effective data communication. With Subframe, you can achieve this effortlessly, thanks to its intuitive interface and responsive canvas.
Ready to create pixel-perfect UI immediately? Start for free and transform your data visualization today!


